Dashboard for Housekeeping Forecast
Stay is enhanced to display the information forecasted for various metrics for a property in a dashboard on the housekeeping screen. The forecast provides information for various metrics such as the count of rooms, guests, groups, room types, and so on for a date range selected by the users.
This information is useful to optimize operations. For example, based on the housekeeping services forecasted for the rooms within a date range, users can plan the assignment of the housekeeping staff for the service requests.
Permission
The following new permission must be assigned to allow users to customize the Forecasting dashboard:
-
Stay_CustomizeHkForecastDashboard
This permission is assigned to the following roles by default:
-
Stay Housekeeping Supervisor
-
HK Supervisor
Display Forecast Information
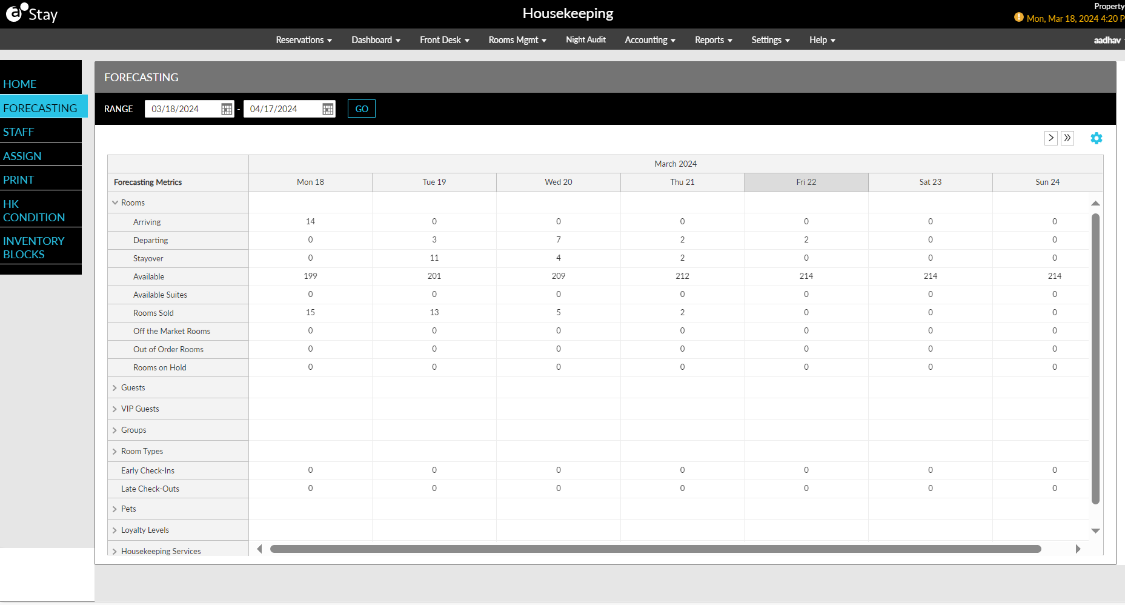
The forecast information is displayed in the newly added Forecasting tab in the Housekeeping screen. This tab contains a table that displays the information forecasted for various metrics for the selected date range.

Users can specify the date range for retrieving the forecast information in the Range date pickers. The information can be retrieved for a maximum range of 365 days. By default, the current property date is the start date, and the end date is 30 days from the current property date.
The forecast information is displayed for the following metrics in the Forecasting tab:
|
Metrics |
Description |
|---|---|
|
Rooms |
The following details are displayed in this section. |
|
Arriving |
The total count of reservations whose arrival date falls within the selected date range. For shared reservations, the count is considered as 1. |
|
Departing |
The total count of reservations whose departure date falls within the selected date range. For shared reservations, the count is considered as 1. |
|
Stayover |
The total count of stayover reservations for the selected date range. For shared reservations, the count is considered as 1. |
|
Available |
The total count of rooms available to be assigned to reservations. This count is calculated as follows: Total Rooms - (Off the Market Rooms + Out of Order) – Rooms Sold. |
|
Available Suites (virtual suites or component rooms) |
The total count of suite rooms available to be assigned to reservations. This count is calculated as follows: Total Suites - (Off the Market Suites + Out of Order Suites) – Suites Sold. |
|
Rooms Sold |
The total count of rooms that are booked/reserved. |
|
Off the Market Rooms |
The total count of rooms that have an Off the Market inventory block created for the selected date. |
|
Out of Order Rooms |
The total count of rooms that have an Out of Order inventory block created for the selected date. |
|
Rooms on Hold |
The total count of rooms that have an On Hold inventory block created for the selected date. |
|
Guests |
The following details are displayed in this section. |
|
Arriving |
The total count of guests associated with reservations whose arrival date falls within the selected date range. |
|
Departing |
The total count of guests associated with reservations whose departure date falls within the selected date range. |
|
Stayover |
The total count of guests associated with stayover reservations for the selected date range. |
|
VIP Guests |
The following details are displayed in this section. |
|
Arriving |
The total VIP guest count associated with reservations whose arrival date falls within the selected date range. |
|
Departing |
The total VIP guest count associated with reservations whose departure date falls within the selected date range. |
|
Stayover |
The total VIP guest count of guests associated with stayover reservations for the selected date range. |
|
Groups |
The following details are displayed in this section. |
|
Pick-ups |
The total count of reservations booked against a group block for the selected date range. |
|
Blocks |
The total count of group blocks created for the selected date range. |
|
Room Types |
The following details are displayed in this section. |
|
Available |
The total count of rooms available for each room type. |
|
Sold |
The total count of rooms sold for each room type. |
|
Early Check-Ins |
The total count of early check-ins performed for the selected date range. |
|
Late Check-Outs |
The total count of late check-outs performed for the selected date range. |
|
Pets |
The total count of pets associated with reservations for the selected date range. |
|
Loyalty Levels |
The total guest count for each loyalty program available at the property. |
|
Housekeeping Services |
The total count of housekeeping service requests scheduled for the selected date range. |
The forecast information is displayed for each date in the selected date range for a maximum of 7 days at a time. For future dates, the housekeeping services count is displayed based on the housekeeping pattern configured for the reservations. For rooms with inventory blocks, the dashboard displays the services that will be triggered when the inventory block expires.
Buttons are provided in the dashboard to help users scroll through the dates. When users click the > button, information for the next successive date is displayed. When users click the >> button, information for the next 7 days is displayed.
Customize Display of Metrics
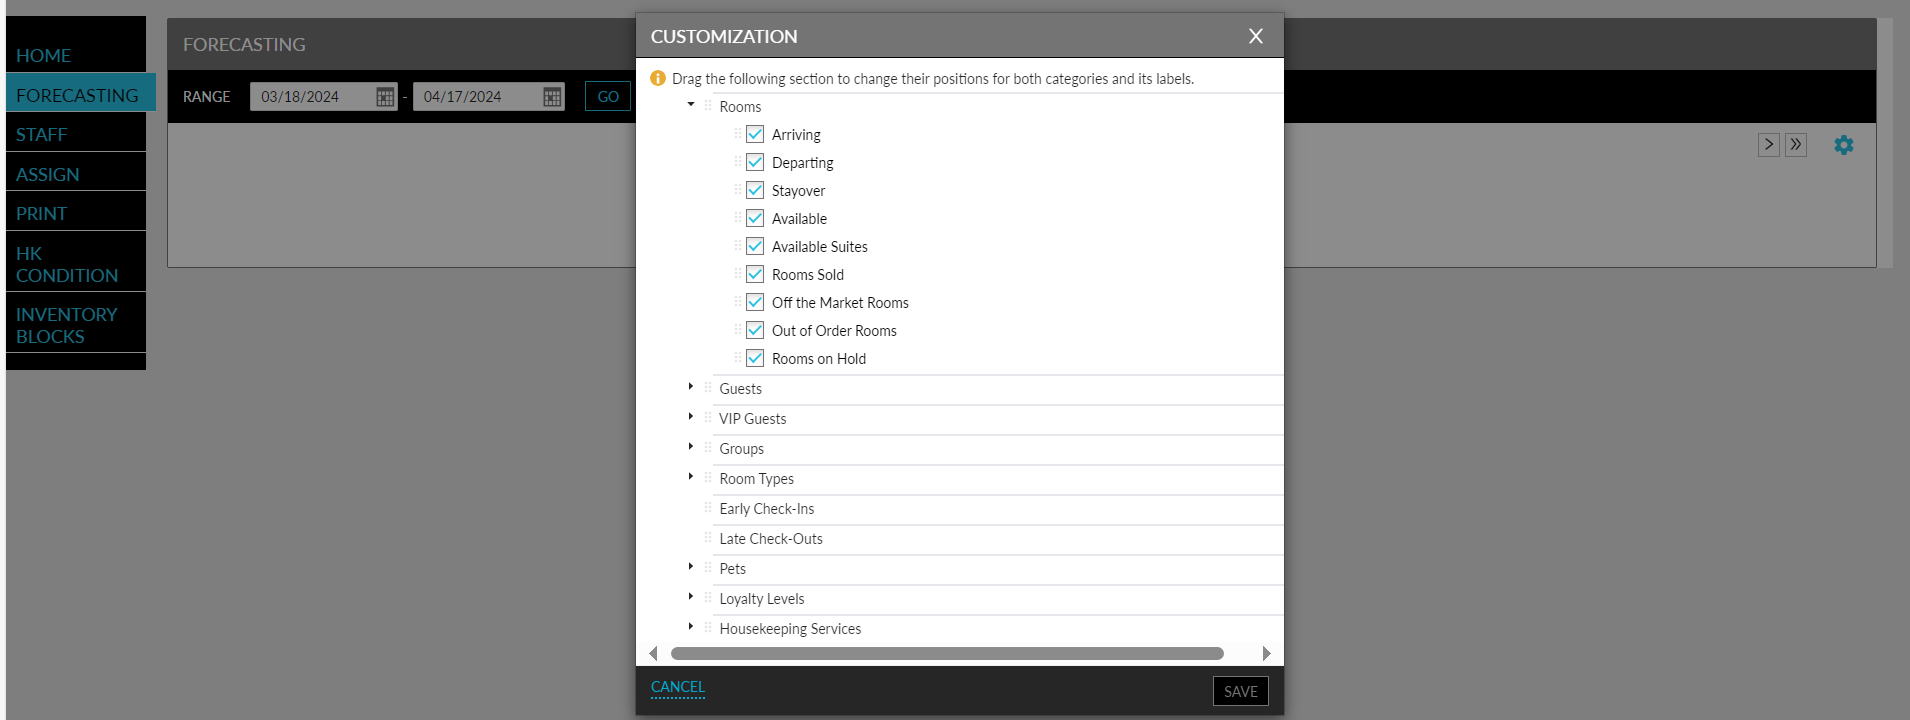
Users with the Stay_CustomizeHkForecastDashboard permission can select the categories and sub-categories to be displayed in the Forecasting tab from the Customization pop-up screen. This pop-up screen is displayed when users click the settings icon in the Forecasting dashboard.

Users can select the checkboxes for the preferred metrics and rearrange the order they are displayed by dragging and dropping the category. The subcategories can be reordered only within the respective category. When users click Save, the changes are updated in the table.
System Changes
To support this enhancement, a new menu, Forecasting, has been added to the Housekeeping screen.